Research an issue, choose a database, and present the data in an interactive medium
Spring 2020
_______________
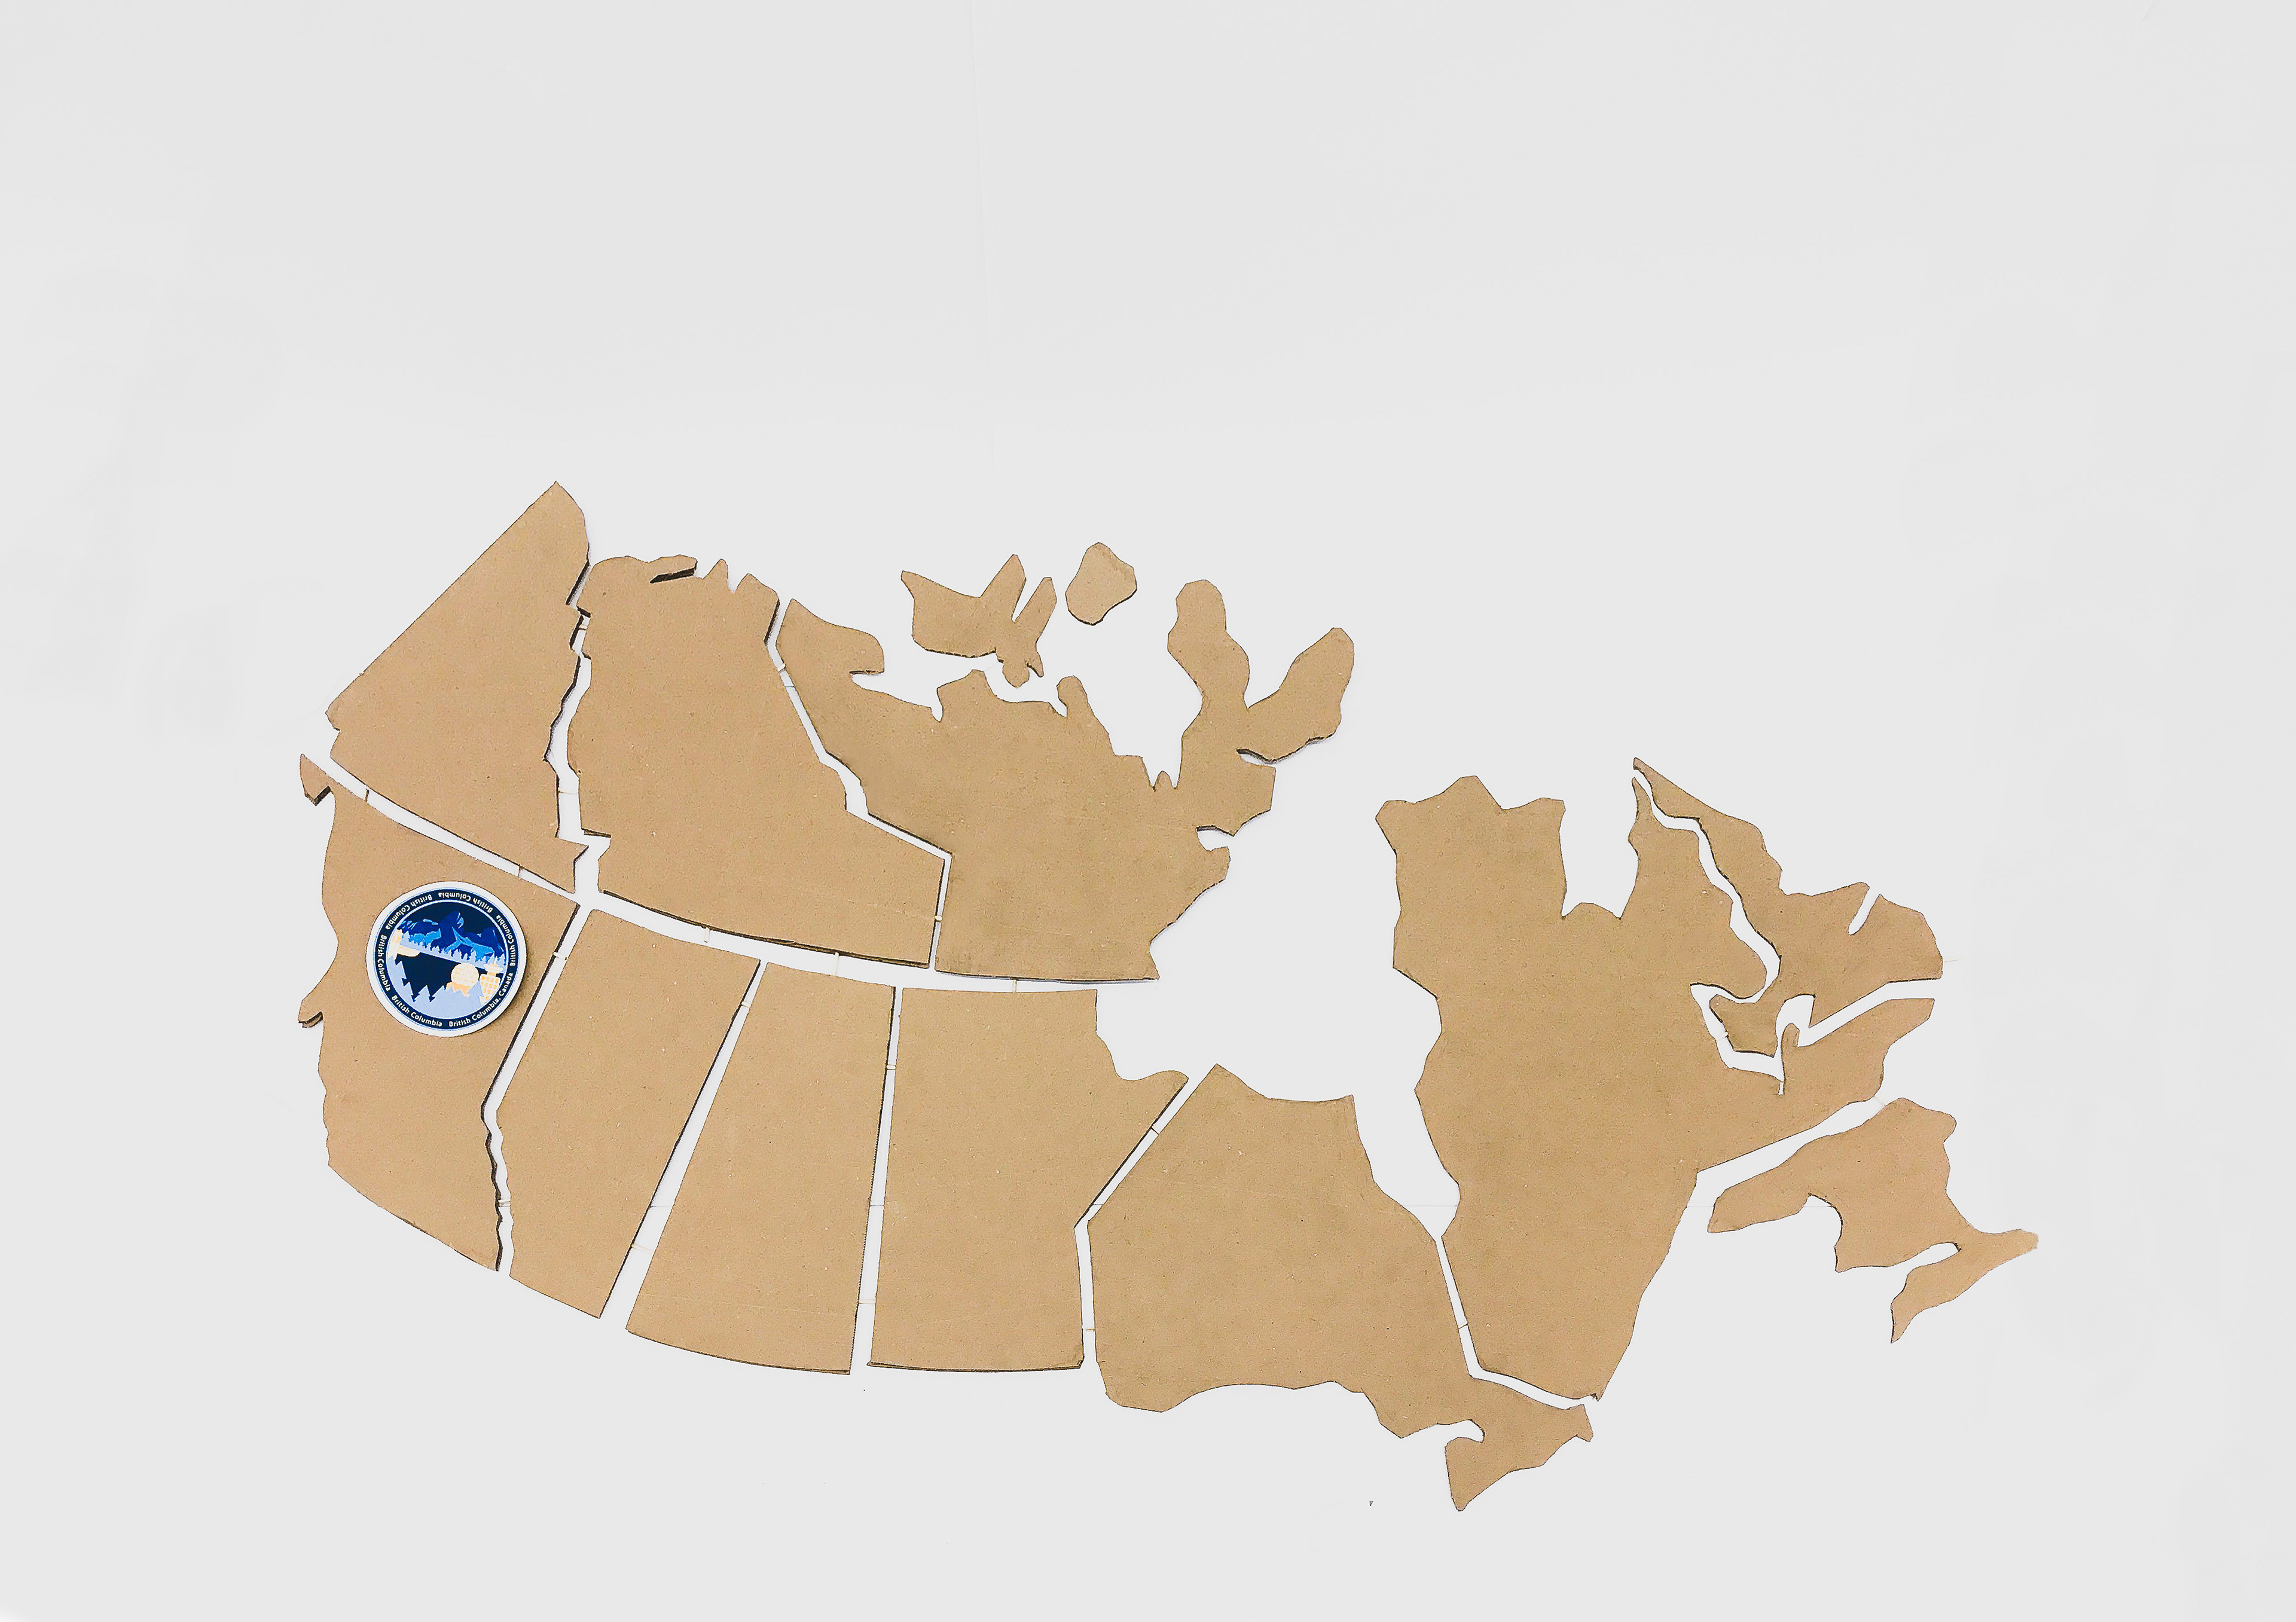
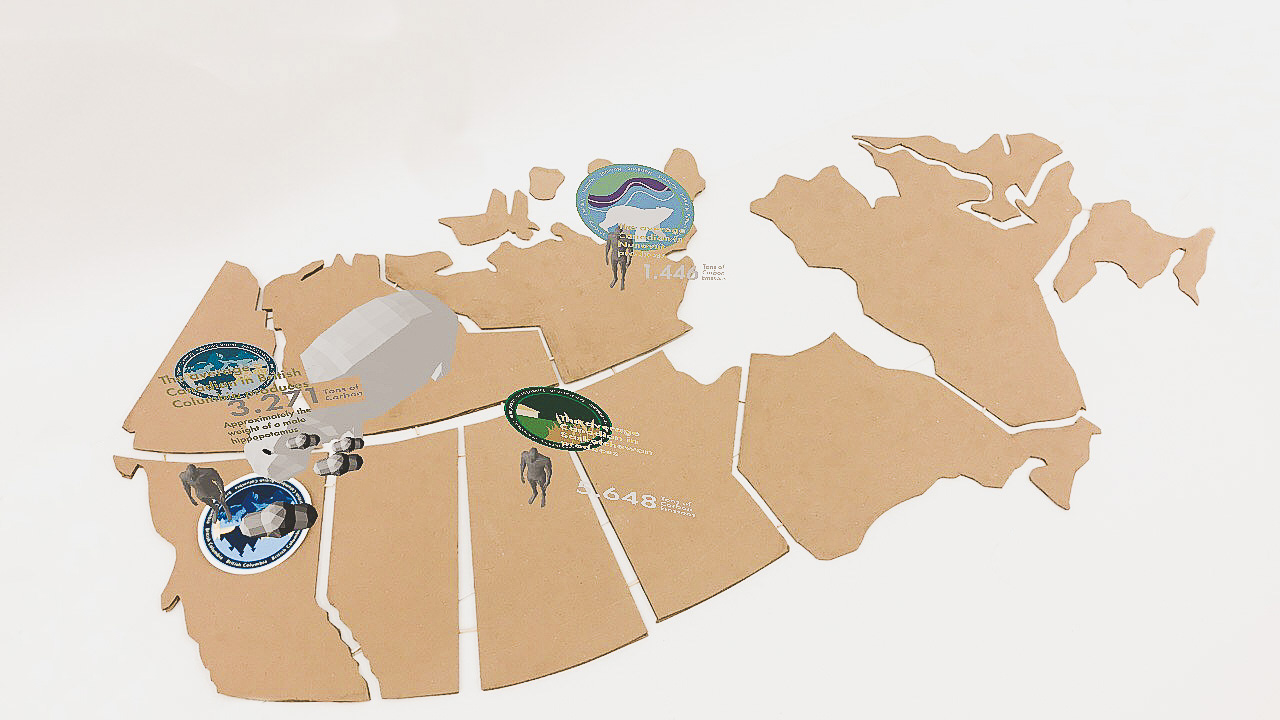
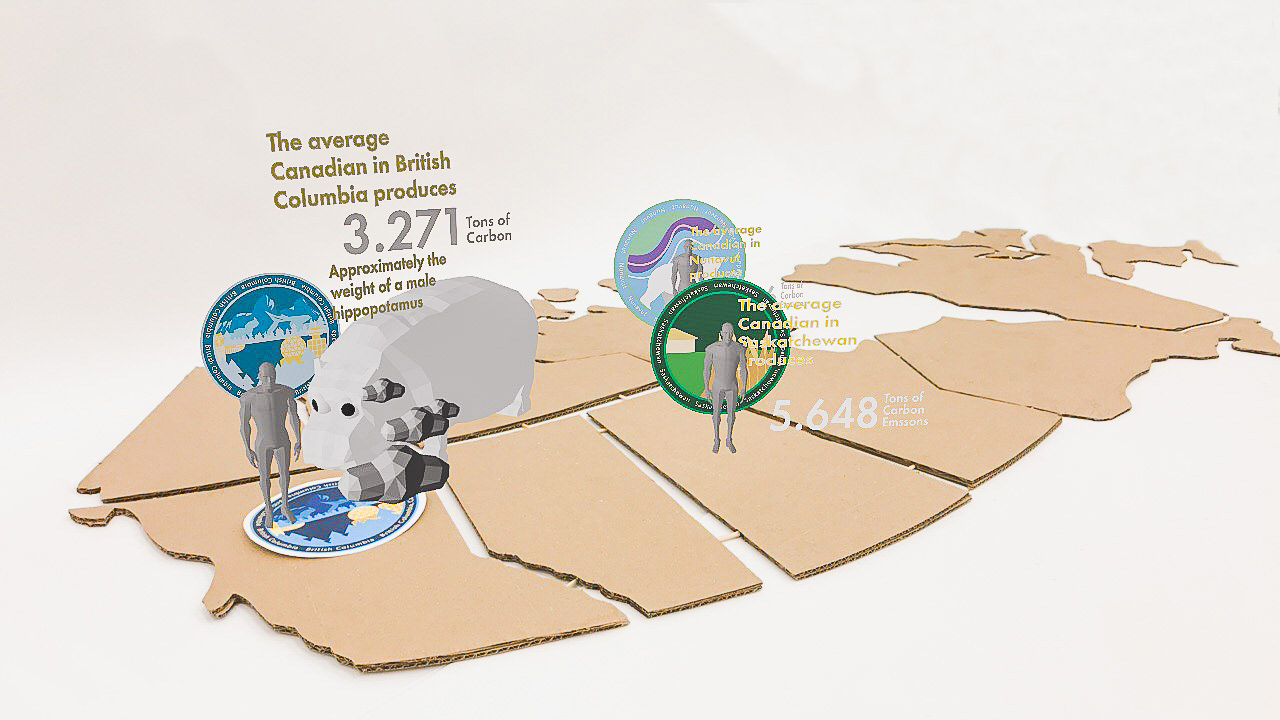
A cardboard map of Canada overlayed with interactive AR components visually communicating carbon emissions per capita by province and territory